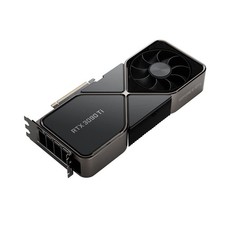
Test Your NVIDIA GeForce RTX 3090 Ti
Free Browser-Based WebGPU Benchmark • No Download Required
NVIDIA GeForce RTX 3090 Ti
Avg Score: 166,046 • Top 8.1% globally
Running Benchmark
📊 NVIDIA GeForce RTX 3090 Ti Statistics
Score Range: 38,433 - 297,952 points
First Tested: March 16, 2026
Latest Test: October 16, 2026
Based on 9 real-world tests from users worldwide. Scores represent WebGPU compute and rendering performance in browser.
ℹ️ About This Test
This WebGPU benchmark tests your NVIDIA GeForce RTX 3090 Ti's performance using two key metrics:
⚡️ Compute Test: Measures parallel processing power through matrix multiplication operations
🎮 Rendering Test: Evaluates 3D graphics performance with vertex and fragment shaders
Your final score combines both tests equally. All testing happens locally in your browser - no downloads required.
🛒 Current Market Prices
As an Amazon Associate and eBay Partner, we earn from qualifying purchases at no extra cost to you.